If you want to become a good crypto trader, one of the important skills you need is reading crypto charts. Many beginners look at crypto charts. Feel confused because of all the lines, candles and indicators.. The truth is, once you understand the basics crypto charts become much easier to read.
In this guide we will focus on crypto charts, candlestick charts which are the most commonly used charts in crypto trading. By the end you will be able to understand crypto price movements and make crypto trading decisions.
What is a Crypto Chart
A crypto chart is really a picture that shows how a crypto coins price changes, over time. It helps people see how the price of a crypto coin goes up and down when people buy and sell it.
Crypto traders look at these crypto charts to figure out what is happening with the price of a crypto coin and to try to guess what the price of a crypto coin will do next.
You can look at real-time crypto charts on a website called TradingView. This is a website that a lot of crypto traders use every day to check the price of their crypto coins.
What are Candlestick Charts
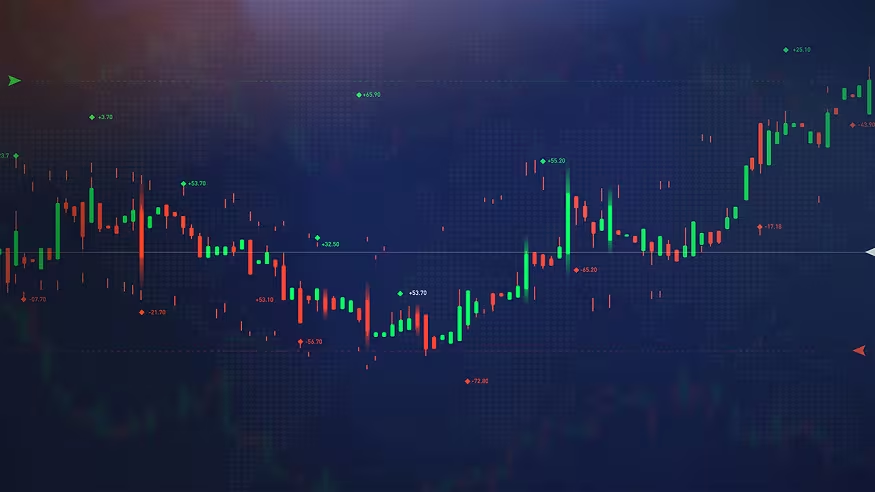
Candlestick charts display crypto price movements in the form of candles. Each candle represents crypto price action within a time period, such as 1 minute, 1 hour or 1 day. Of just showing a line candlesticks give more detailed information, which makes them very useful for crypto analysis.
Structure of a Candlestick
Every candlestick has four parts. It shows the opening crypto price, the closing crypto price, the highest crypto price and the lowest crypto price during a time period. The thick part of the candle is called the body and the thin lines above and below are called wicks or shadows. If the crypto price closes higher than it opened the candle is usually green. If it closes lower it is red. This simple structure gives you a lot of information about crypto price movements at a glance.
What Candles Tell You
Candles are not just shapes. They tell a story about crypto market behavior. A long green candle shows buying pressure in the crypto market. A long red candle shows selling pressure in the crypto market. Small candles often indicate indecision in the crypto market. Long wicks can signal that the crypto price was rejected at a level. By observing candles you can understand who is in control. Crypto buyers or crypto sellers.
Common Candlestick Patterns
Candlestick patterns help crypto traders predict what might happen next in the crypto market. Some common patterns include:
- A bullish engulfing pattern, where a strong green candle covers the red candle often signals a potential crypto price increase.
- A bearish engulfing pattern suggests the opposite, where crypto sellers are taking control.
- A doji candle shows indecision, where the opening and closing crypto prices are the same.
- Hammer and shooting star patterns can indicate reversals in the crypto market. You can practice identifying these patterns on TradingView crypto charts.
Importance of Timeframes
Timeframe selection is very important when reading crypto charts. When we talk about crypto trades we usually think about timeframes, like five minutes. On the hand we use longer timeframes, like one day or one week to look at bigger crypto trends.
Beginners should start with crypto timeframes because crypto timeframes are easier to understand and less noisy. This is a way to start with crypto trades. Crypto timeframes will help beginners to get a feel, for crypto trades. As you gain experience you can explore timeframes.
Identifying Trends
One of the goals of reading crypto charts is to identify crypto trends. An uptrend is when the crypto price keeps making highs and higher lows. A downtrend is when the crypto price keeps making highs and lower lows.
Combining Candles with Support and Resistance
Candlestick analysis becomes more powerful when combined with support and resistance levels. Support is where crypto price tends to stop falling while resistance is where it tends to stop rising.When a candlestick pattern forms near these levels it becomes more meaningful because the candlestick pattern is really important, near these levels.
Common Mistakes Beginners Make
Many beginners struggle because they make mistakes. They focus much on small timeframes and get confused by crypto market noise. They rely on a pattern without considering the overall crypto trend. They also make decisions instead of following a crypto trading plan. Avoiding these mistakes can improve your crypto trading significantly.
How to Practice Chart Reading
The way to learn crypto chart reading is through practice. Spend time analyzing crypto charts. Try to identify patterns, trends and key levels. Use demo. Small investments while learning.
Reading crypto charts may seem difficult at first. Once you understand candlesticks it becomes much easier. Candles help you understand crypto market behavior identify crypto trends and make crypto trading decisions. With practice and patience you can improve your crypto chart reading skills and trade with more confidence. In terms crypto charts are, like a language. And once you learn it you can understand what the crypto market is trying to tell you.
Also Check Technical Analysis in Crypto – Powerful Guide – 2026


Leave a Reply