If you want to get better at trading you need to understand support and resistance. These are tools that people use to analyze charts.
Many new traders ignore them. Start using indicators right away but experienced traders know that support and resistance are the foundation of reading charts.
The good thing is that this concept is really simple once you get it. In this guide we will explain everything in a way that’s easy to understand so you can start using support and resistance in your trading.
What is Support
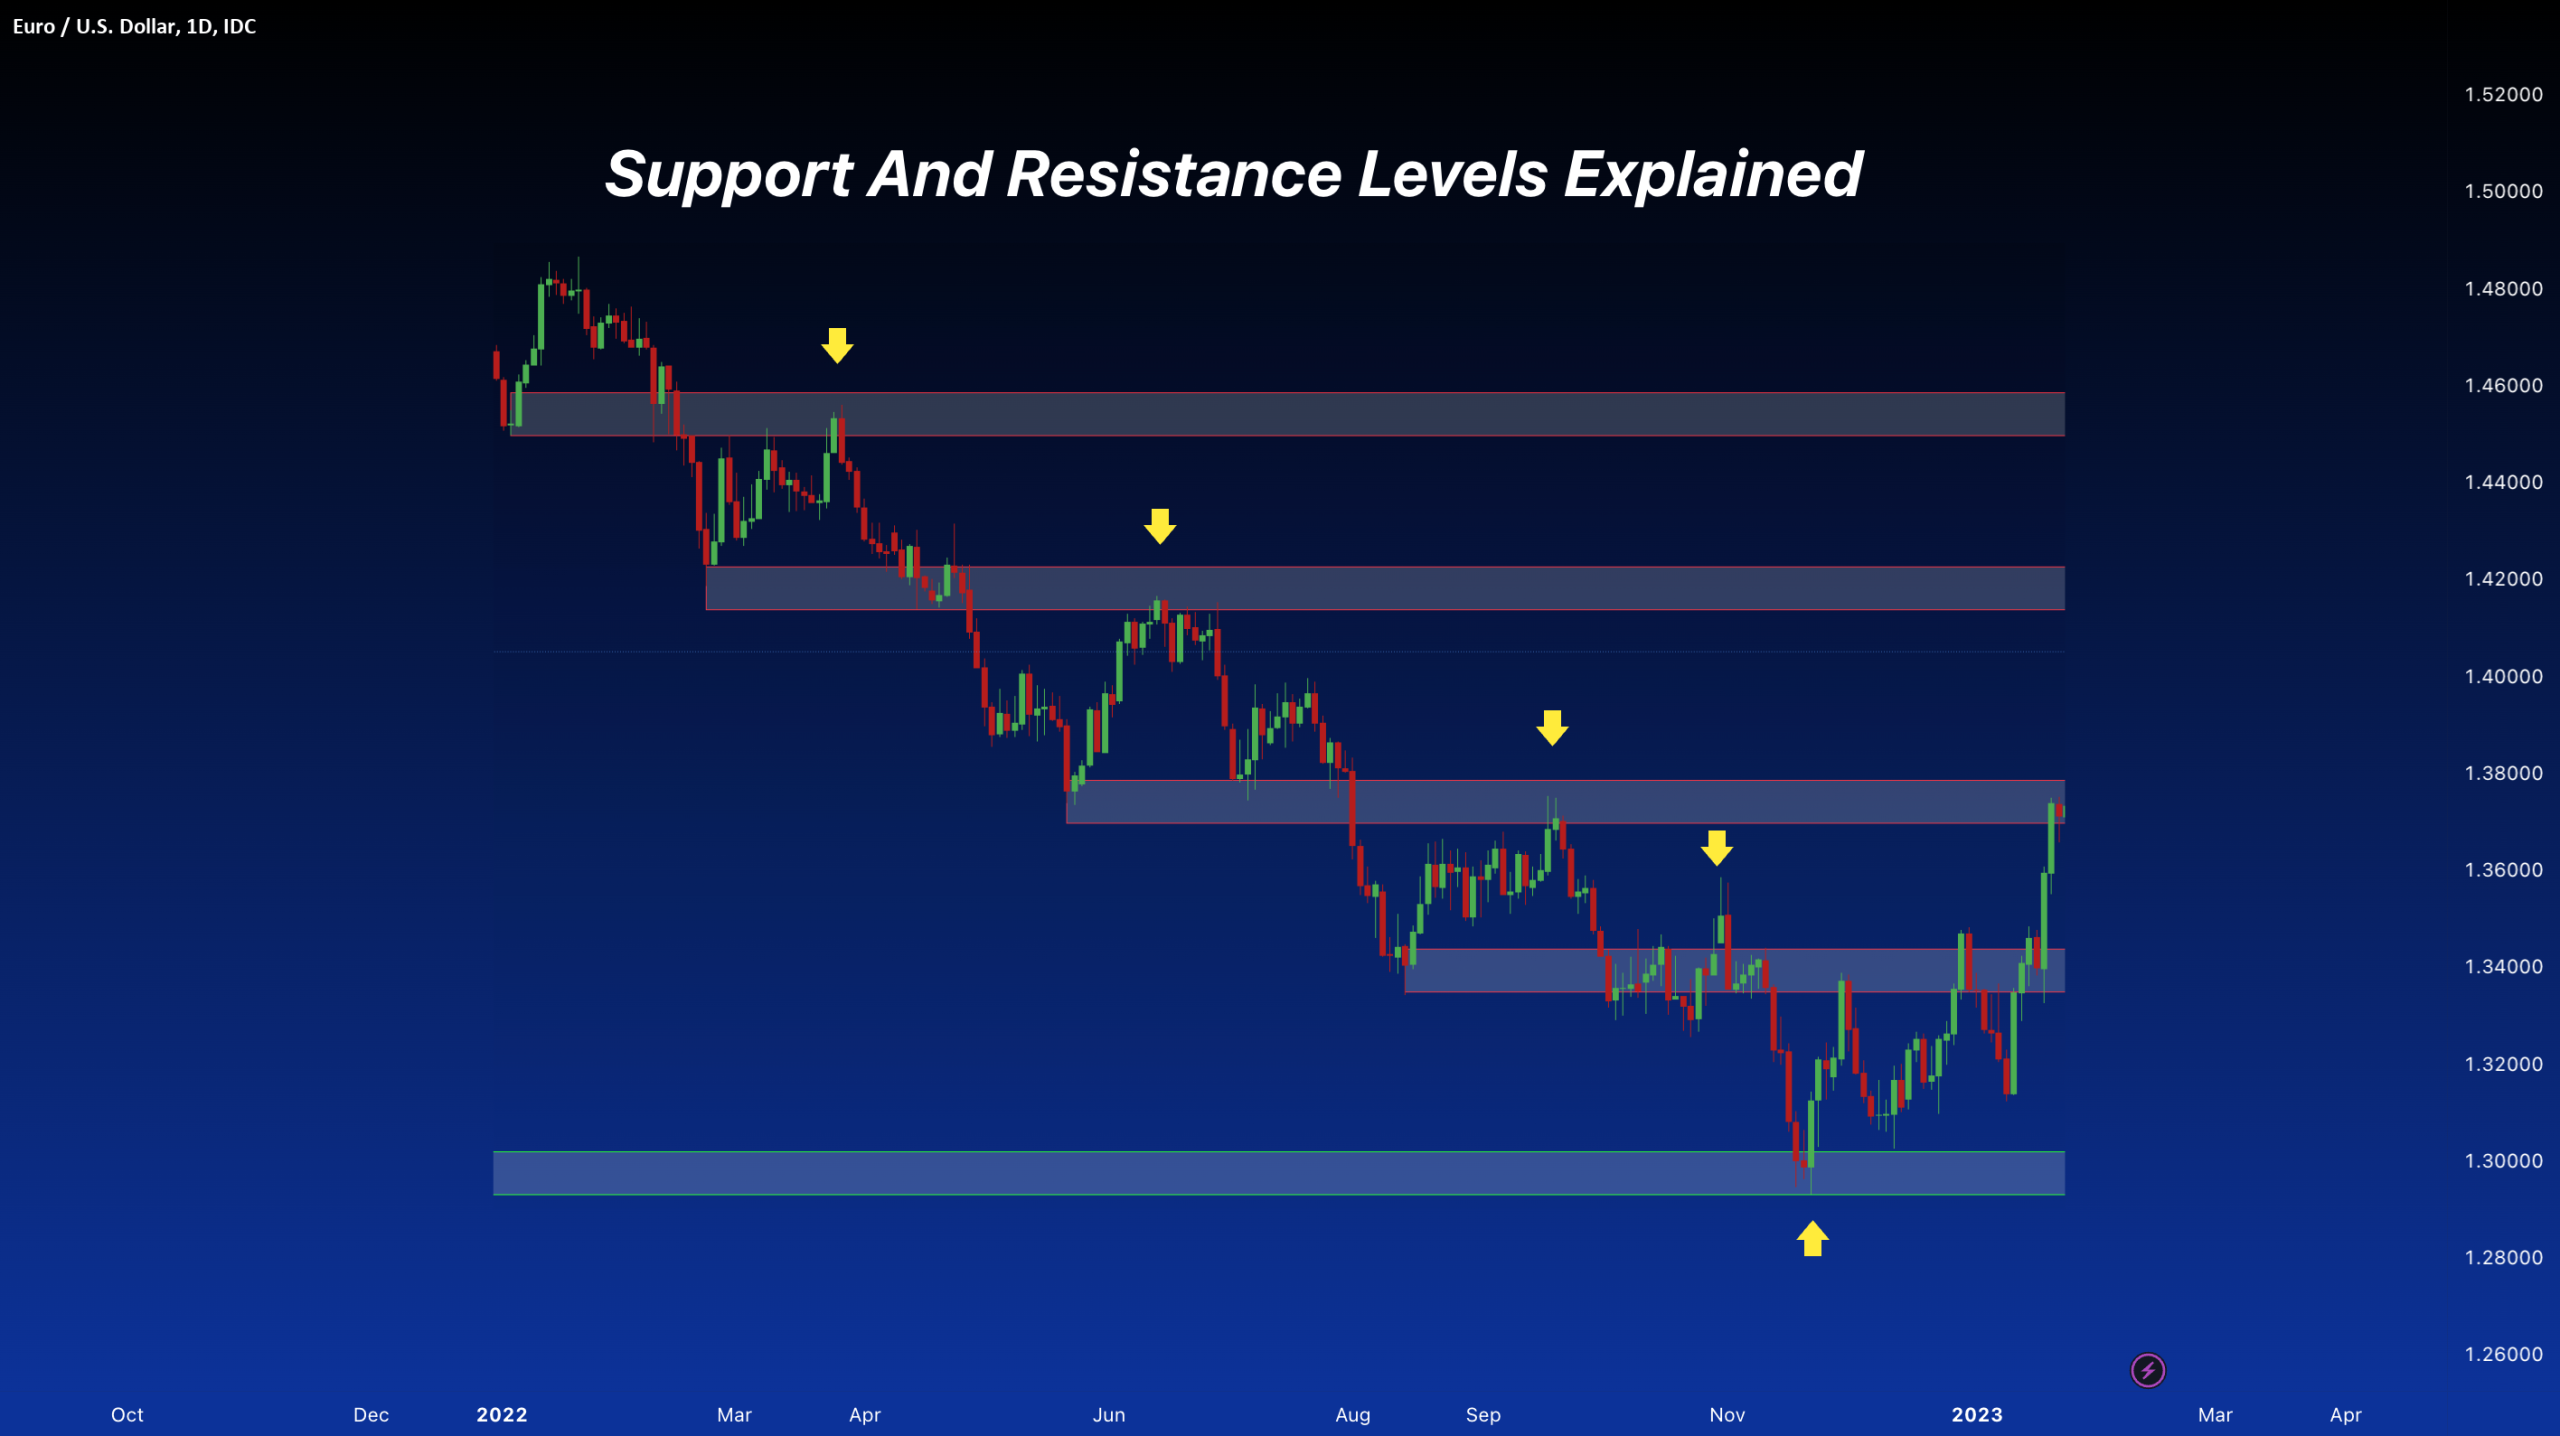
Support is a price point where an asset stops falling and might start going up.
This happens because buyers start buying more at that price. When the price drops to support many traders think it is a time to buy. In words support is like a floor that stops the price from going down.
What is Resistance
Resistance is the opposite of support. It is a price point where the asset stops going up. Might start going down. At this price sellers start selling. Many traders take their profits.
You can think of resistance as a ceiling that stops the price from going up.
Why Support and Resistance Work
Support and resistance work because of how people think.
Traders remember the prices where the market reacted before and when the price comes back to those levels they react again by buying or selling.
This creates patterns in the market that happen over and over. You can see these levels easily on charts using platforms like TradingView and Binance.
Steps to Identify Support and Resistance
- Finding these levels is easier than you think.
- Start by looking at areas where the price has changed direction times. These points usually form support or resistance levels.
- If the price touches a level and bounces back times that level becomes important.
- People use lines to mark these areas on charts.
- The more times a level is tested the stronger it becomes.
Types of Support and Resistance
There are types of support and resistance. Horizontal levels are the common and easiest to find. Trendline support and resistance are formed by connecting lows or lower highs. You can also create levels using indicators like moving averages. All these types help traders understand where the price might react. Support Becomes Resistance and Vice Versa
One important thing to know is that support can become resistance and resistance can become support.
For example if the price breaks below a support level that same level might act as resistance when the price comes up. This is called a role reversal. Many traders use it.
Steps to Use Support and Resistance in Trading
- Support and resistance levels are useful for planning trades.
- Many traders look for buying opportunities near support levels and selling opportunities near resistance levels.
- They also use these levels to set stop-loss and take-profit points.
- When the price breaks a level it can signal the start of a new trend.
- This is why these levels are so important in trading decisions.
Real-Life Example
Imagine a coin keeps falling to a price and then bouncing back up. That price becomes support. Now imagine the coin rises to a certain price and keeps getting rejected. That price becomes resistance.When you look at these patterns you can make decisions. You do not have to guess what to do. Looking at these patterns really helps you make decisions, about the patterns.
Common Mistakes
- Charts are supposed to help us understand things. If a chart has many lines on it it can be hard to figure out what is going on. Many lines, on the chart is one mistake that people make when they are trying to show information on a chart.
- Another mistake is thinking of support and resistance as numbers instead of zones.
- The price does not always react at a point. It usually reacts within a range.
- Some traders also ignore the trend. This can lead to decisions.
- They should pay attention to the trend.
- Ignoring it can be bad, for making choices.
Tips to Improve Your Analysis
- Keep your charts clean and focus on levels.
- Use timeframes to find strong support and resistance areas.
- Combine these levels with candlestick patterns for confirmation.
- Practice regularly. Review past charts to improve your accuracy.
Conclusion
Support and resistance are concepts in technical analysis. They help you understand where the price is likely to react and guide your trading decisions. By learning how to find and use these levels you can improve your accuracy and confidence in the market. In terms support and resistance help you read the market like a map.
The more you practice the better you become at finding opportunities. Support and resistance are key, to understanding the market. The more you learn about support and resistance the better trader you will become.
Also Check Top Technical Indicators Crypto Trader Should Know 2026


Leave a Reply