When you understand charts and candlesticks and support and resistance the next big step is learning about chart patterns.
Chart patterns help traders figure out what the market might do next. You do not have to guess what will happen you can recognize patterns that show breakouts or reversals or continuations.
At first these patterns might look confusing. Once you learn a few key patterns, your skills at reading charts will get a lot better.
In this guide we will explain the important chart patterns in a way that is easy to understand. This way you can start using them when you trade.
What are Chart Patterns
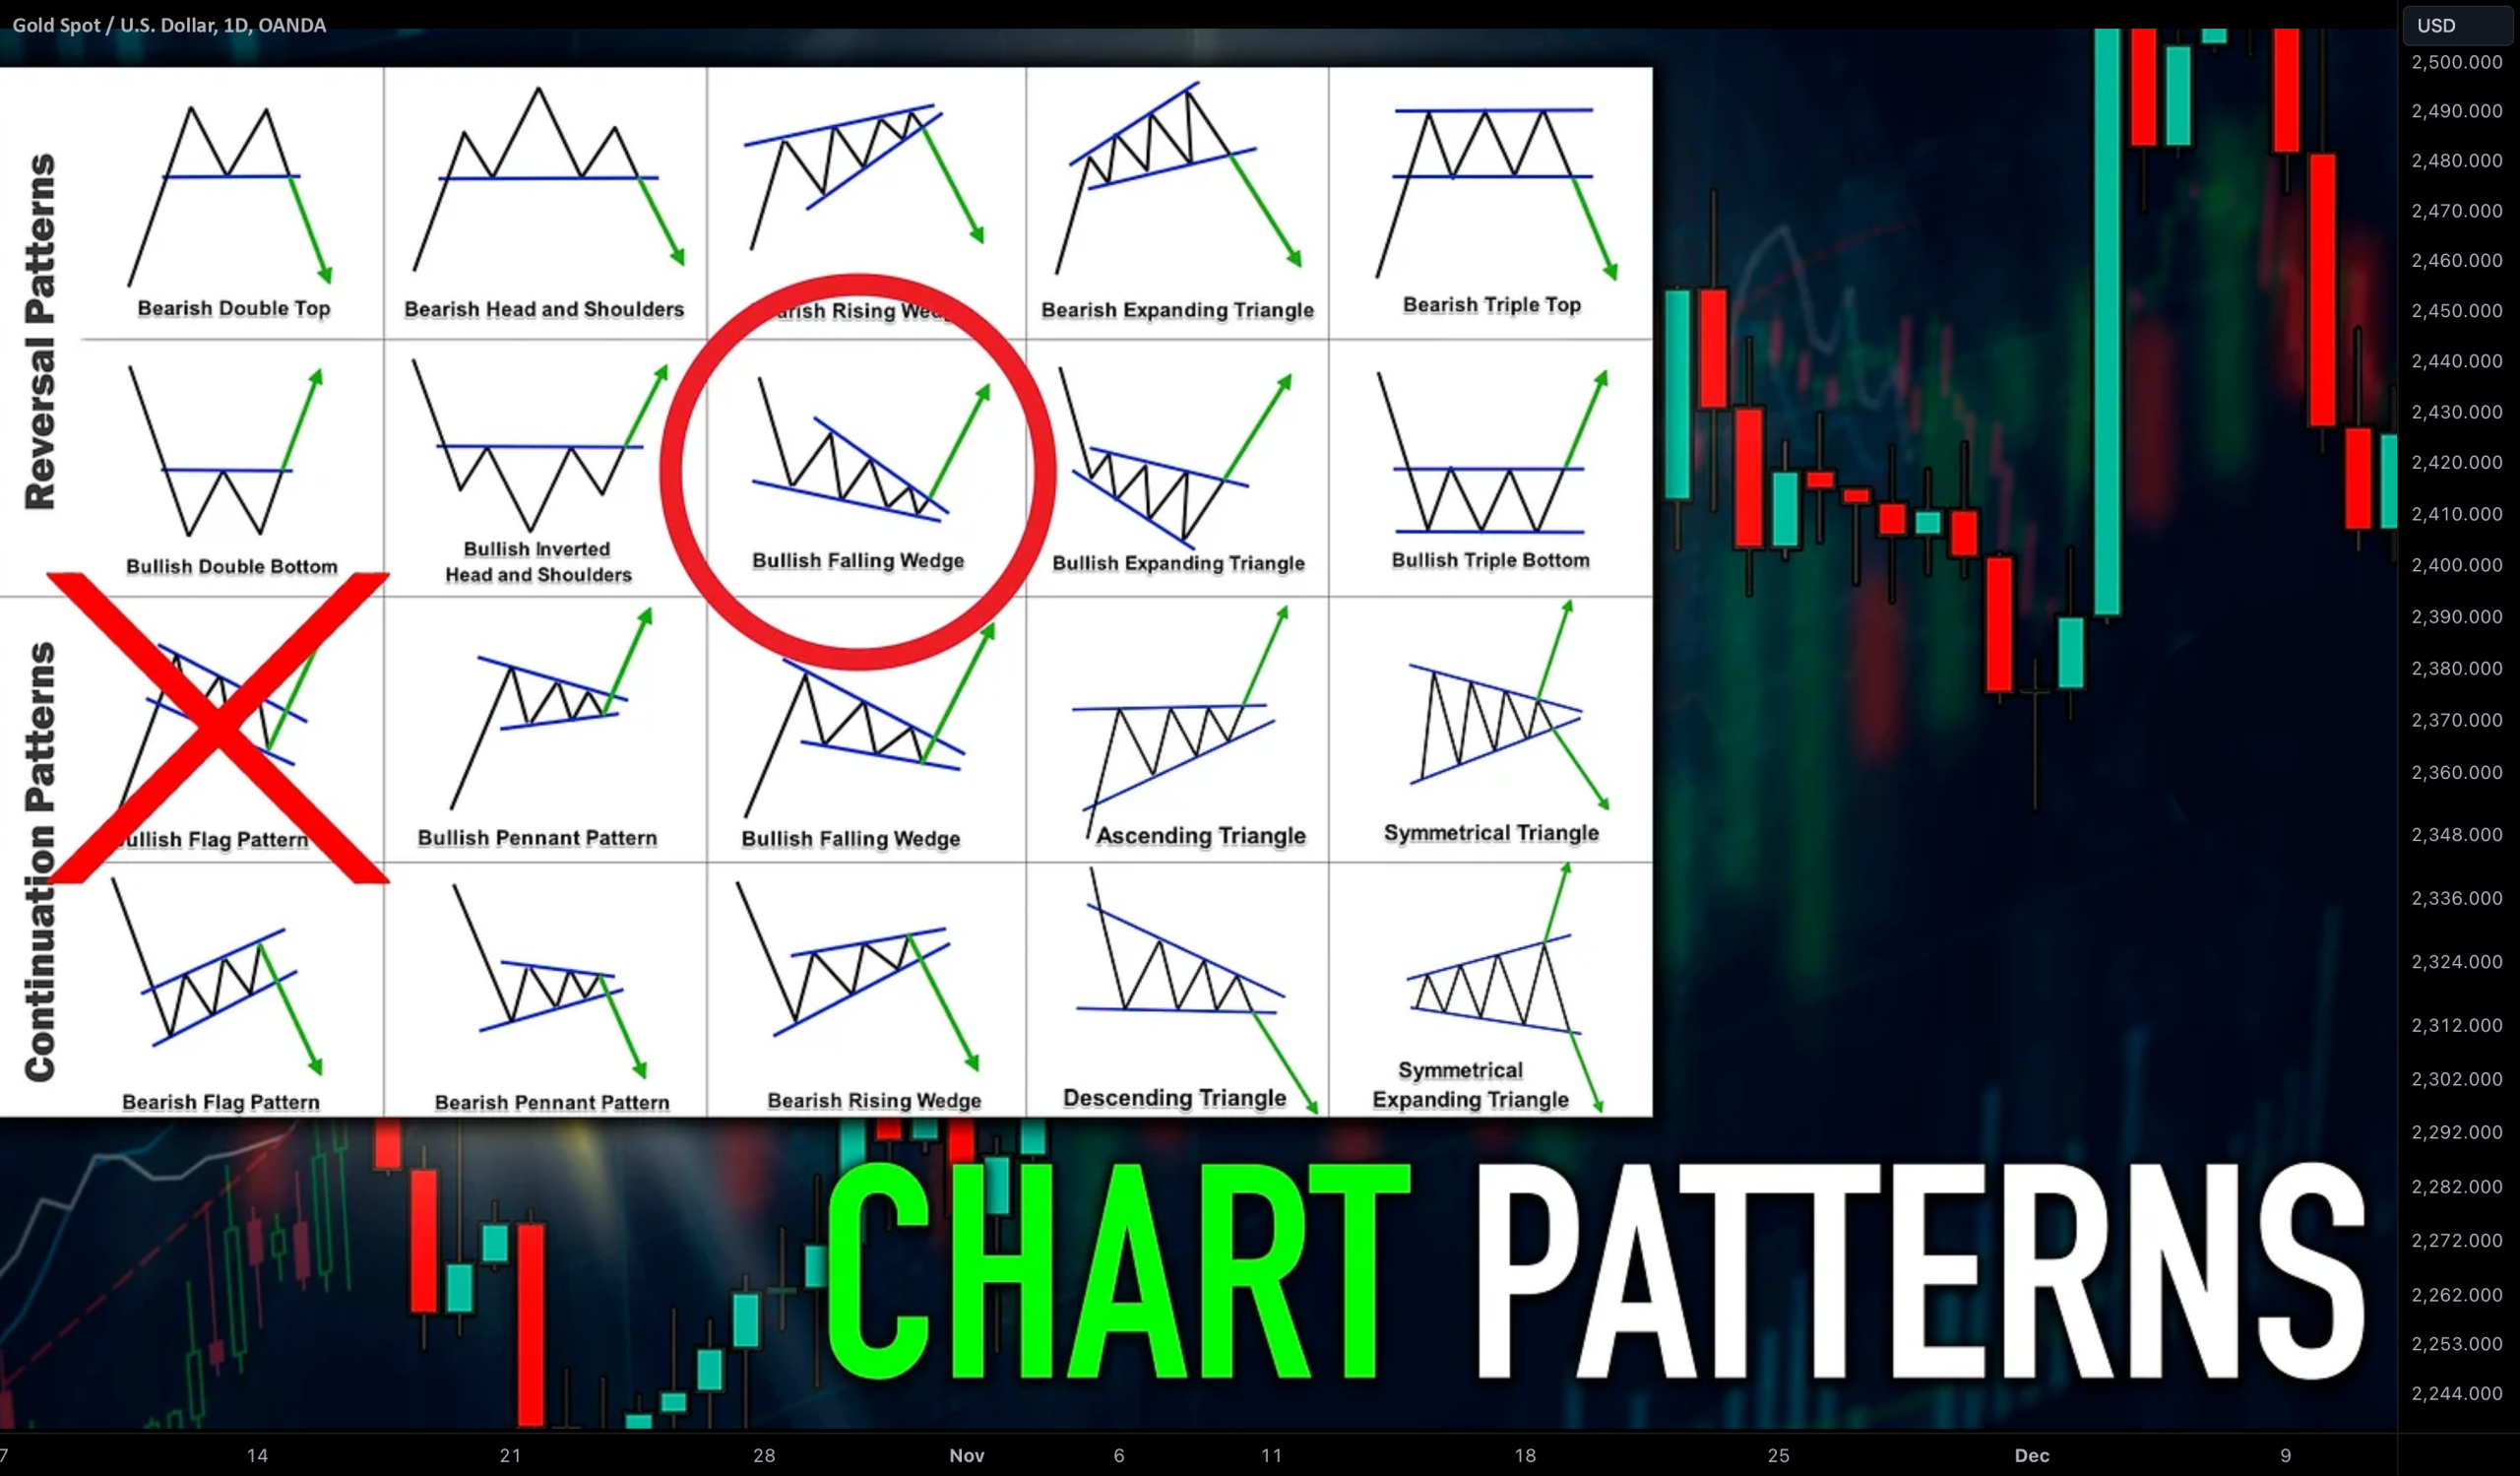
Chart patterns are shapes that are made by the way prices move on a chart.
These patterns happen because of the way people think and behave in the market. Buyers and sellers do things in ways over time which creates patterns that happen again and again.
Traders study these patterns to try to predict which way prices will go in the future. You can practice finding these patterns on websites like TradingView.
Why Chart Patterns Matter
Chart patterns give you a way to analyze the market that makes sense. You do not have to make decisions when you trade. You can look for signs that tell you it is a time to enter a trade.
Chart patterns help you understand when a trend might keep going. They help you know when a reversal might happen. They help you know where to enter and exit trades. This makes your trading more logical and less based on emotions.
Head and Shoulders Pattern
This is one pattern that people like to look at when they think the market is going to change direction.
It has three peaks and the one in the middle is the highest the other two peaks, on the sides are lower.
This pattern is interesting because it usually means that the market is going up and now it is going to start going down so the uptrend is about to turn into a downtrend the uptrend is going to change into a downtrend.
When the neckline is broken traders often enter trades based on the direction.
Top and Double Bottom
These patterns are simple but very useful. A double top happens when the price tries to break a resistance level but fails. This often shows that a bearish reversal is about to happen. A double bottom is the opposite.
It happens when the price tests a support level twice and bounces back which shows that the price might go up. These patterns are easy to spot and very useful for people who’re new to trading.
Triangle Patterns
Triangle patterns show that the price is getting ready to break out. There are three types of triangle patterns. An ascending triangle happens when the price makes lows and faces resistance.
This often leads to a breakout upward. A descending triangle happens when the price makes highs and faces support.
This often leads to a breakout downward. A symmetrical triangle happens when the price gets squeezed between two lines that are getting together. The breakout can happen in either direction. Triangles show that a big move is about to happen.
Flag and Pennant Patterns
These patterns show that a trend will continue. They happen during trends. A flag looks like a rectangle that forms after a big price move. A pennant looks like a triangle. Both patterns show that the trend will keep going after a pause. They are often used by traders who follow trends.
Cup and Handle Pattern
This is a pattern that shows a continuation. It looks like a bottom followed by a small consolidation. When the price breaks above the resistance level it often keeps going This pattern is popular because it shows that buyers are gradually taking control before a breakout.
How to Use Chart Patterns
Chart patterns are not just for finding patterns. They also help with making decisions.
You can use them to plan when to enter a trade set stop-loss levels and define profit targets.
For example traders often enter a trade after a breakout. Set stop-loss below key levels.
Using patterns along with support and resistance levels makes your trading a lot more accurate. When you use patterns with support and resistance levels it really helps you make trades. The support and resistance levels are very important, in trading so using patterns with these levels makes your trading more accurate.
Common Mistakes
- Beginners rely too much on patterns without looking for confirmation.
- Another mistake is trying to force patterns on charts where they do not exist.
- Some traders also ignore volume, which’s important for confirming breakouts.
- Chart patterns take time to learn.
- Start by looking at charts every day and trying to find patterns in time.
- You can also study charts to see how patterns worked out.
- Using tools like TradingView can help you practice and get faster.
Conclusion
Chart patterns are tools that help you understand how the market behaves and make better trading decisions.
In terms chart patterns help you know what the market is likely to do next. And that is a big advantage for any trader. Chart patterns help you make sense of the market and make decisions when you trade.
You can use chart patterns like head and shoulders. Double tops to find potential breakouts and reversals. Remember chart patterns are, like tools that help you understand the market and make trades.
Also Check Support and Resistance Levels – Comprehensive Guide 2026


Leave a Reply